What If You Never Had to Configure Another Log Alert Again?
Modern systems generate terabytes of logs every day. Most of them are just routine activity — successful requests, health checks, normal service operations. But hidden in that stream are the failures no one set alerts for. By the time someone notices, the system is already degraded.
The Alert Configuration Problem
Every observability tool on the market — Splunk, Datadog, Grafana, you name it — requires your team to manually configure alerts. Set a threshold. Pick a metric. Define a condition. Hope you covered the right failure modes.
But production systems don't fail in ways you anticipate. The real incidents are the ones nobody wrote an alert for:
- The OOM crash that slipped through because it only happens under a specific load pattern
- The database timeout that cascaded across three services before anyone noticed
- The auth failure pattern slowly increasing over hours
- The retry storm caused by a failing dependency that looked healthy on the dashboard
- The connection pool exhaustion under sudden load spikes
- The deadlock in a background job worker that silently stopped processing
- The API latency spike affecting only one downstream service
- The misconfigured deployment causing intermittent 503s that looked like normal noise
These are subtle patterns that are nearly impossible to catch with static alert thresholds. A developer has to manually trace logs for a bunch of traceIDs. They have to spend time on Splunk or Datadog log dashboards. And what happens if they never set an alert for a particular issue? It goes unnoticed.
This Is Why We Built LogClaw
LogClaw ingests your logs and performs automated incident discovery. Instead of relying on manual alert configuration, it analyzes log streams and surfaces anomalous failure patterns automatically.
Here's how it works:
- 1.Ranks every log event — filters the 90%+ healthy noise. Successful requests, health checks, and routine operations are ranked low and ignored.
- 2.Detects anomalies using signal-based scoring — error velocity, statistical deviation (z-score), recurrence patterns, and blast radius across services.
- 3.Reconstructs the full failure path — retrieves all logs sharing the same traceID, from the first request to the final error, across every service it touched.
- 4.Runs AI analysis on the anomaly cluster — identifies the likely root cause using LLM-powered analysis of the correlated log evidence.
- 5.Creates a deduplicated incident report — with root cause summary, supporting evidence logs, affected services, full trace timeline, and severity classification.
What You Actually Get
Instead of a vague "error rate exceeded threshold" alert, LogClaw creates a fully contextualized incident ticket:
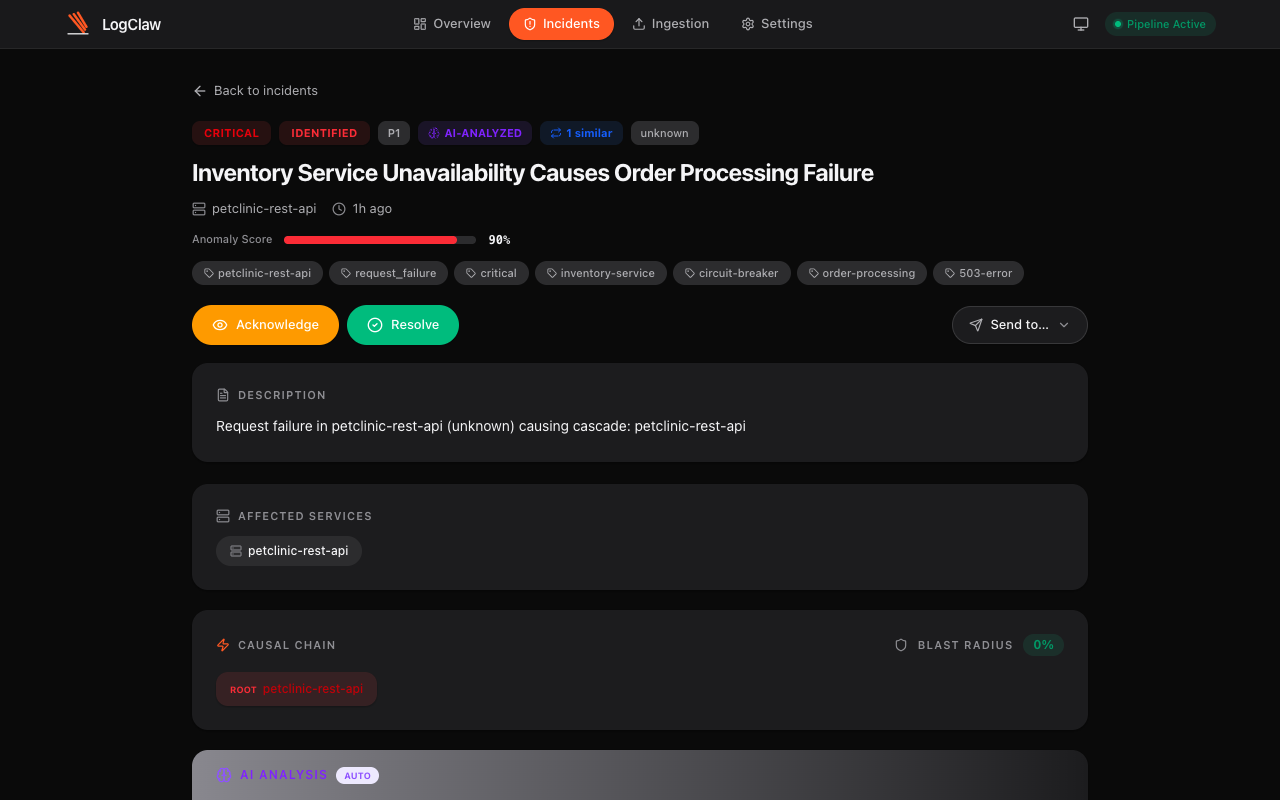
Every ticket includes:
- Root cause summary — AI-generated explanation of what went wrong and why
- Evidence logs — the actual log lines that triggered the anomaly, with full context
- Affected services — every service in the causal chain, mapped automatically
- Full trace timeline — traceID-linked logs from start to finish across all microservices
- Blast radius — percentage of services and traffic impacted
- Severity classification — P1 through P4, based on composite anomaly scoring
- One-click actions — acknowledge, resolve, or forward to Jira, PagerDuty, ServiceNow, OpsGenie, Slack, or Zammad
Similar incidents are automatically grouped and deduplicated. No duplicate tickets, no alert fatigue.
The Key Difference
Most observability tools help you search logs after something breaks. But they still require your team to configure alerts, define thresholds, and anticipate failure modes ahead of time.
LogClaw approaches the problem differently. Instead of configuring alerts, the system continuously scans all your logs to discover incidents automatically. No threshold tuning. No alert fatigue. No guessing which failures to watch for.
You just fix the root cause. That's it.
How It Handles Scale
A common question: LLMs aren't fast enough to parse terabytes of logs. And that's true — which is why LogClaw doesn't send everything to an LLM. The algorithm ranks every log first. The majority (successful requests, health checks, routine operations) are ranked low and never touch the LLM. Only the flagged anomaly clusters — typically less than 10% of total volume — are analyzed by AI for root cause.
This means LogClaw can ingest terabytes of logs per day while keeping AI analysis costs reasonable and latency under 90 seconds from log noise to a filed incident ticket.
Two Lines of Code to Get Started
LogClaw uses the OpenTelemetry standard — the same protocol your apps may already speak. Point your OTEL SDK at LogClaw's endpoint and you're done:
from opentelemetry.sdk._logs import LoggerProvider
LoggerProvider().add_processor(
BatchExporter(OTLPLogExporter()))import { NodeSDK } from '@opentelemetry/sdk-node'
new NodeSDK({ resource }).start()No proprietary SDK. No sidecar. No agent binary. If your app already uses OpenTelemetry, it's literally two lines of code. If not, the OTEL SDK is a one-time, 5-minute setup for Python, Node.js, Go, Java, .NET, or any language with an OTEL SDK.
Stop configuring alerts. Start fixing root causes.
Open source (Apache 2.0). Deploys inside your VPC. Your data never leaves your infrastructure.